The Effect of Angle of Attack in Flight
This experiment tests and qualifies the physical properties of the Clark Y-14 airfoil. Testing the airfoil in a wind tunnel at air speeds from 20 m/s to 50 m/s and various angles of attack where multiple pitot tubes on the airfoil measured pressure data that was recorded on a data acquisition system.
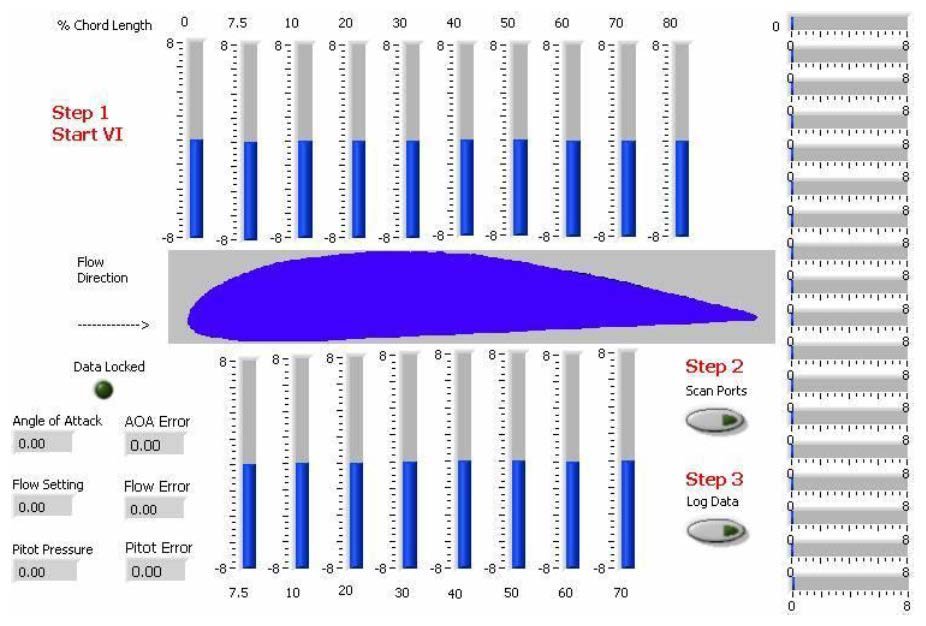
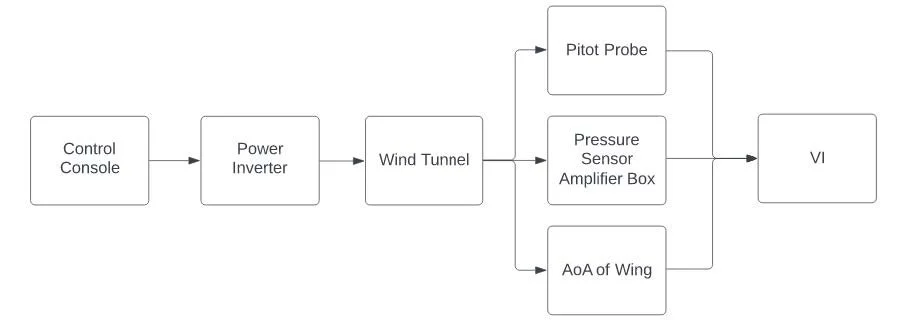
VerticalWing VI front panel display
Apparatus
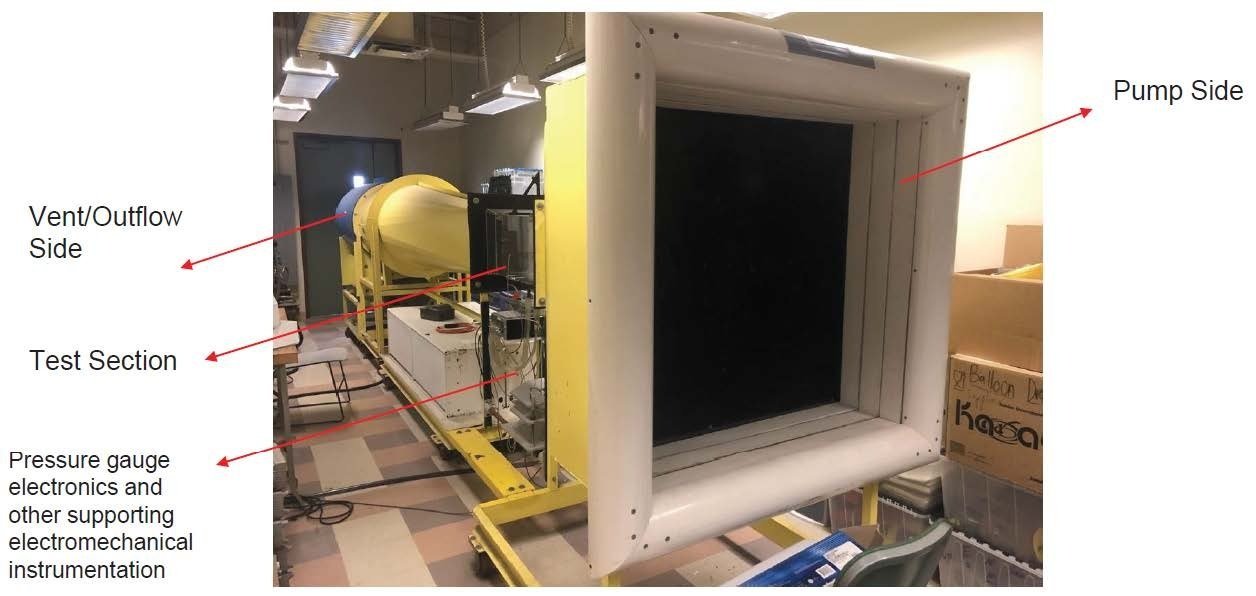
Wind Tunnel
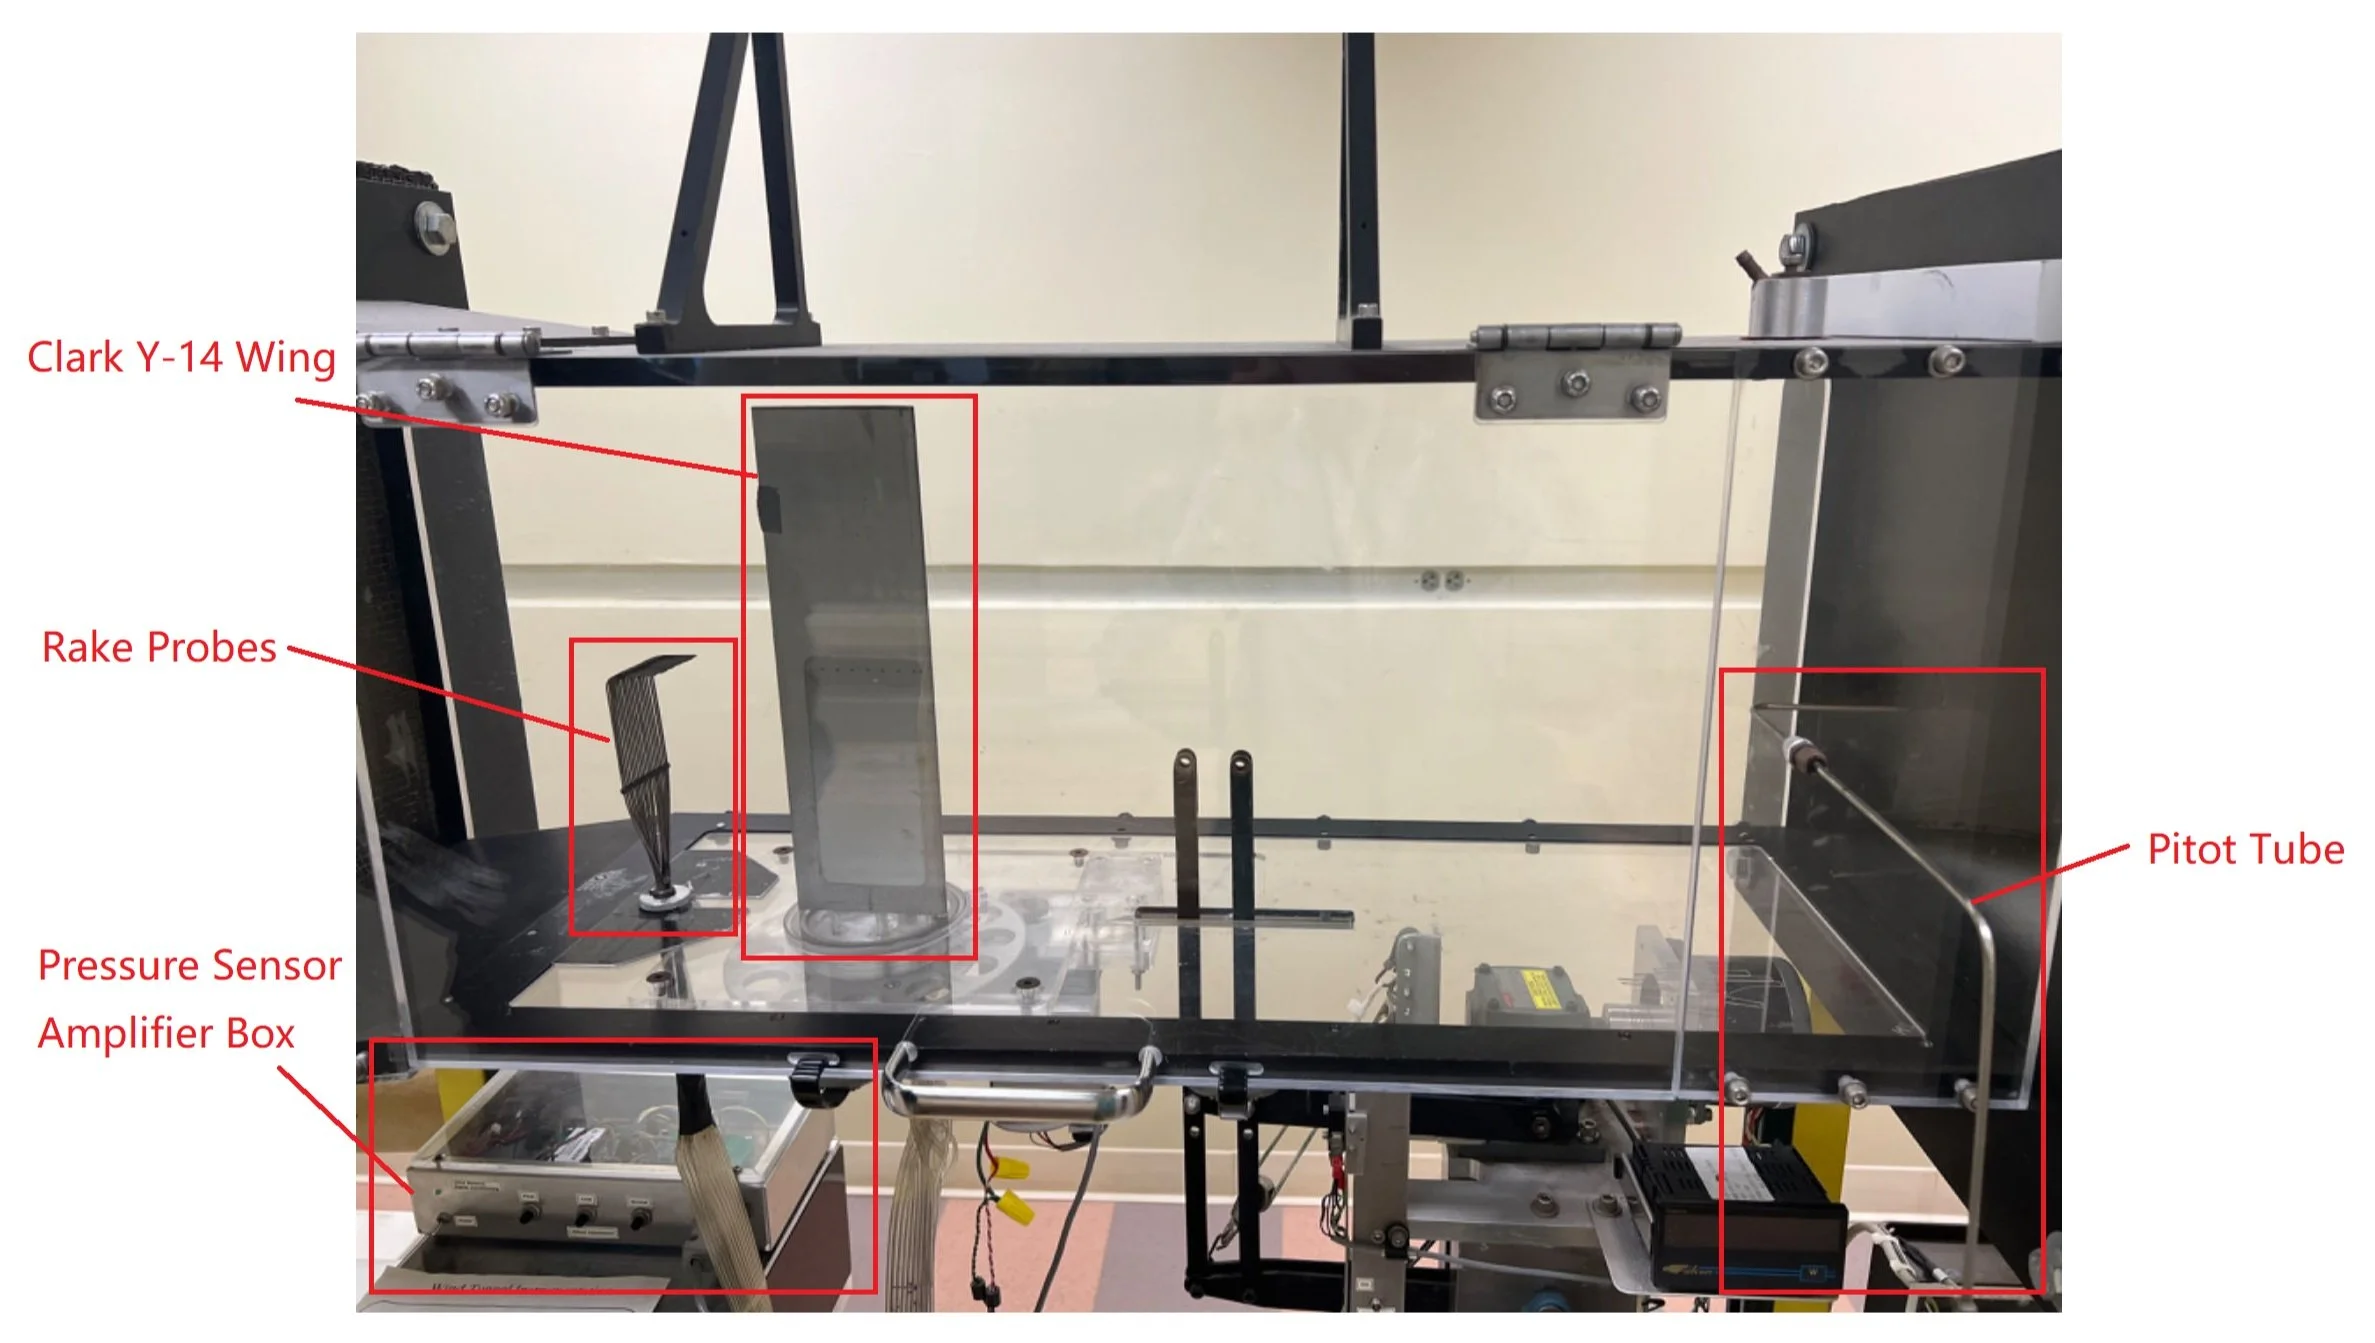
Test Section
Experimental Apparatus and Procedures
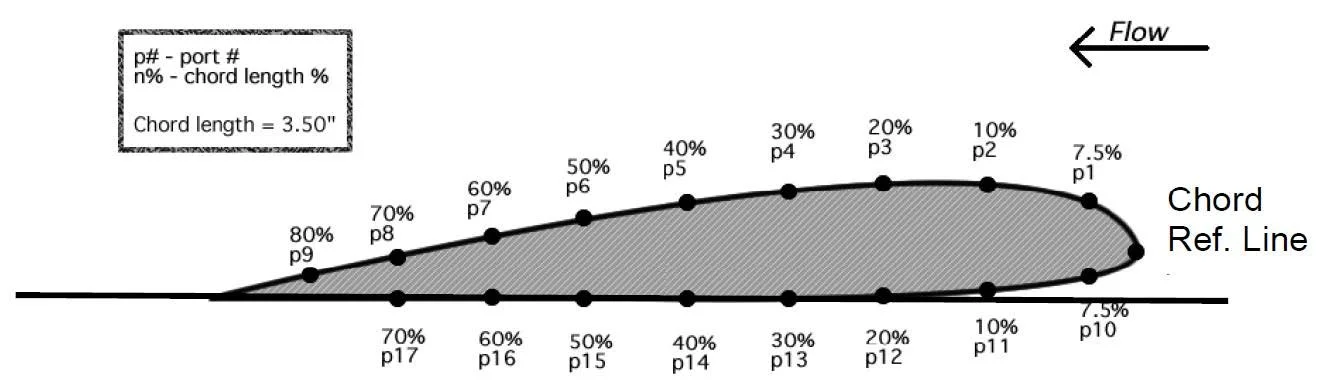
Geometry of the airfoil used for pressure measurements
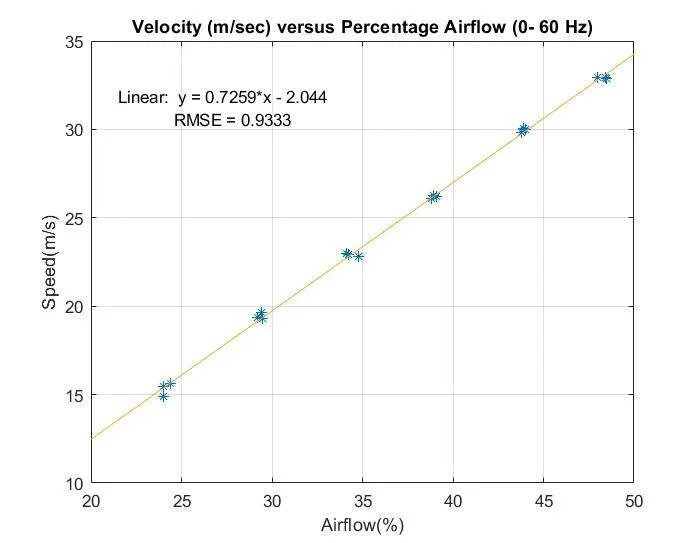
Calibration of the Wind Tunnel
According to the barometer and thermometer, the atmospheric pressure and the temperature during experiment is P = 100.7kPa and T = 22.7℃. Increase the airflow by 5% up to 50% using the control panel. Wait 30 seconds for the flow to stabilize, record the pressure data and compute the airspeed.
Airfoil Pressure Distribution and Wake Survey
Operate the wind tunnel at 20 m/s, 35 m/s, and 50 m/s while taking pressure readings at different angles of attack of 0°, 4°, 8°, 12°, and 16°.
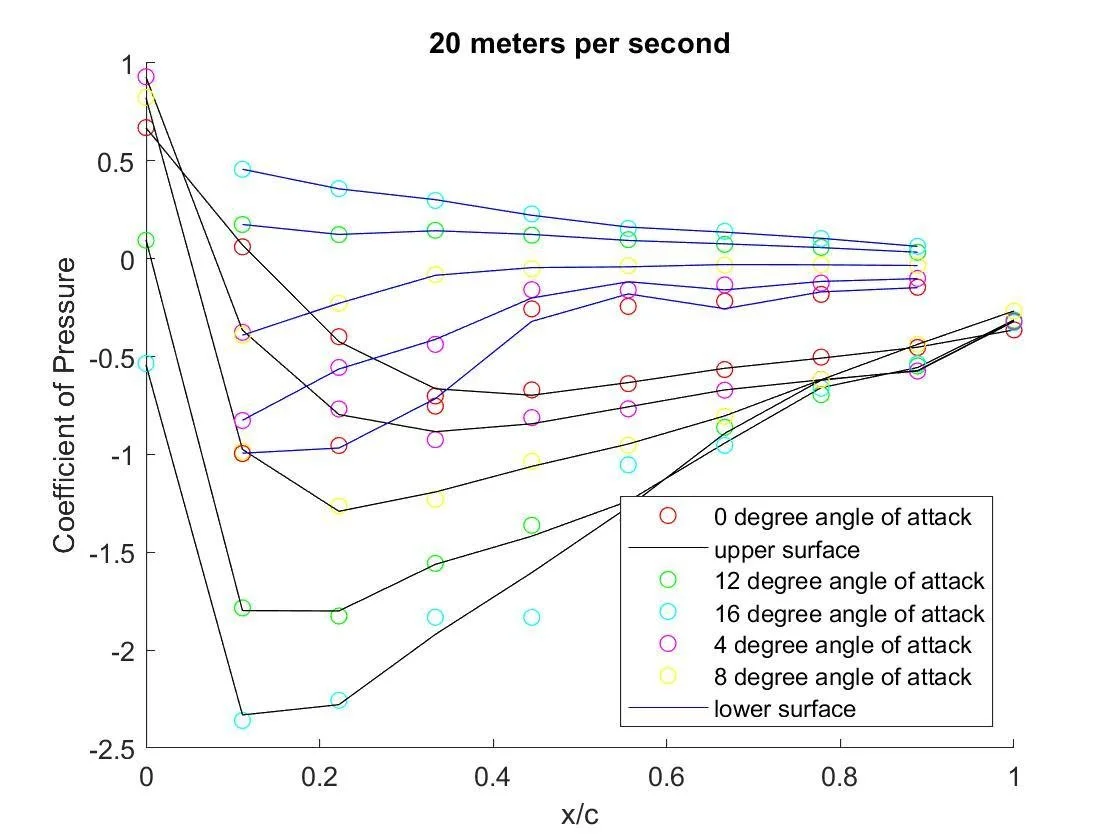
Coefficients of pressure along the airfoil chord at AoA from 0° to 16° at 20 m/s on upper and lower surfaces
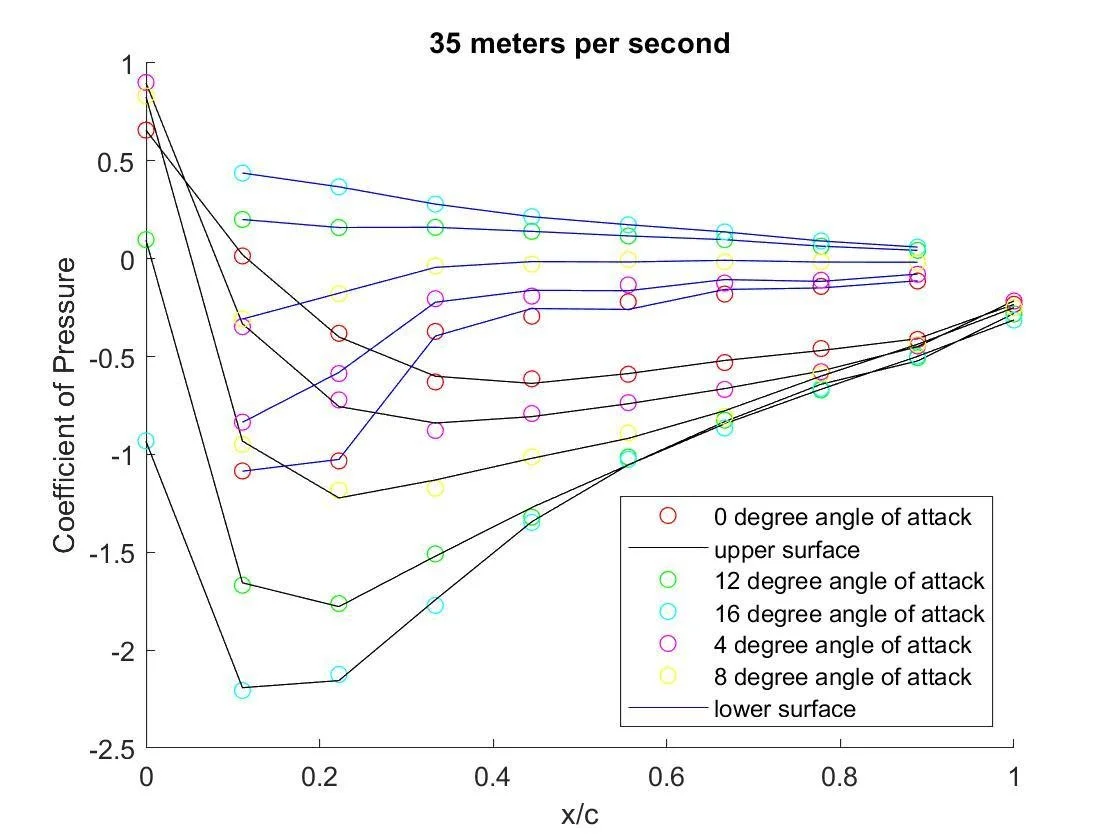
Coefficients of pressure along the airfoil chord at AoA from 0° to 16° at 35 m/s on upper and lower surfaces
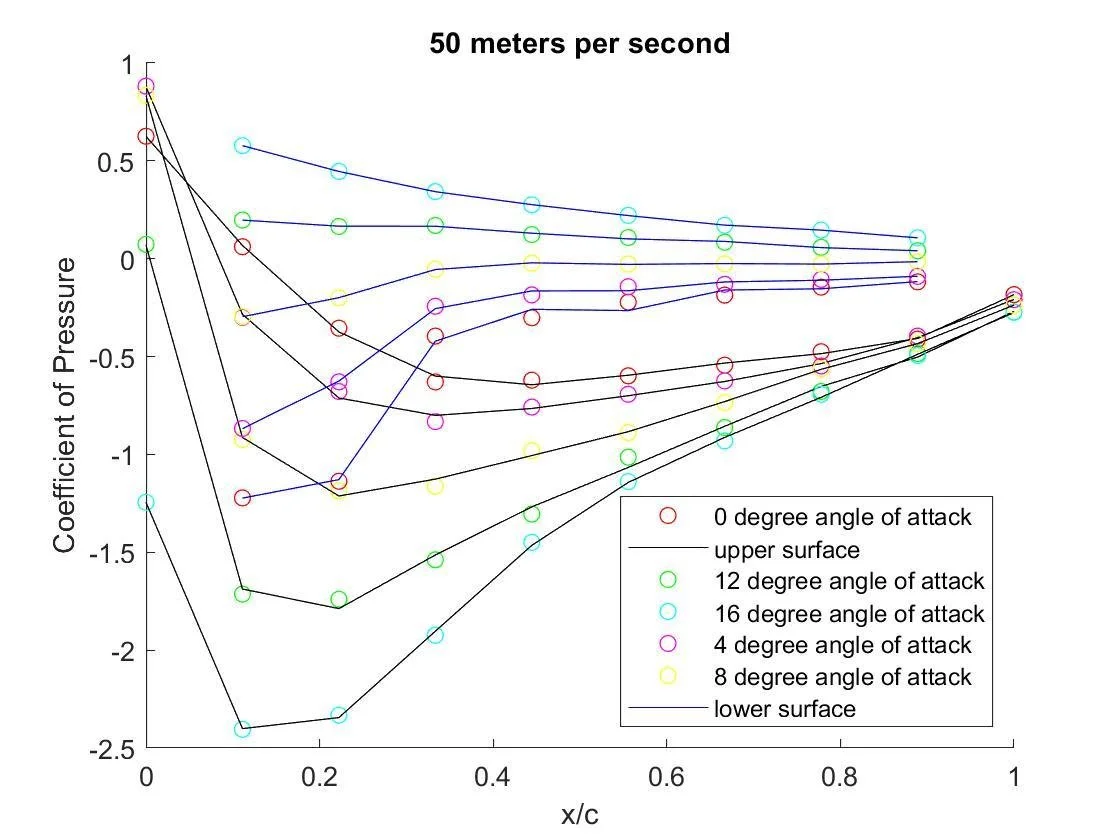
Coefficients of pressure along the airfoil chord at AoA from 0° to 16° at 50 m/s on upper and lower surfaces
As the plot of the pressure data shows, the center of pressure moves closer to the leading edge as the AoA is increased. At 0° AoA, the center of pressure appears to be much further from the airfoil leading edge while the other angles of attack can be attributed to centers of pressure that slowly approach the leading edge.
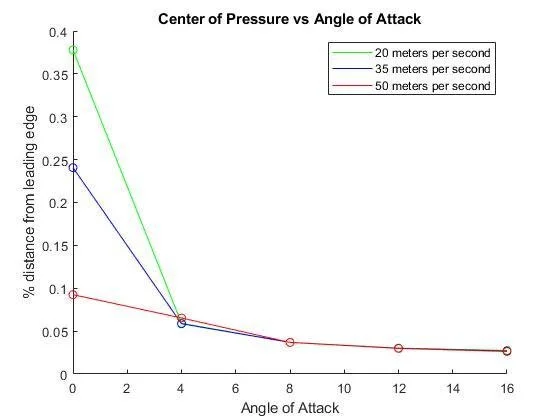
Location of the center of pressure on the airfoil versus the AoA at speeds of 20, 35, and 50 m/s
Manipulating the measured pressure data, the center of pressure was plotted against the angle of attack as well as the coefficients of lift, drag, and leading-edge moment. All 3 speeds tested follow a similar trend up to 12° where they begin to differ.
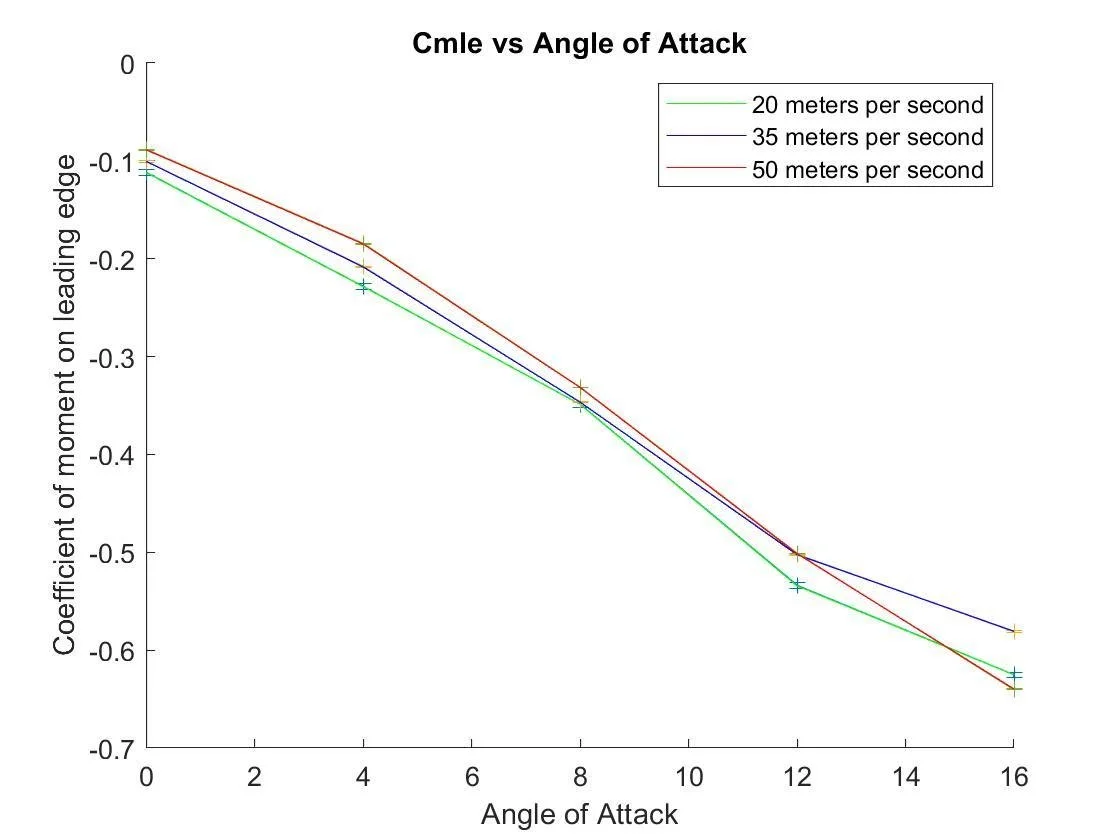
Coefficient of the moment induced on the leading edge of the airfoil vs AoA at 20, 35, and 50 m/s
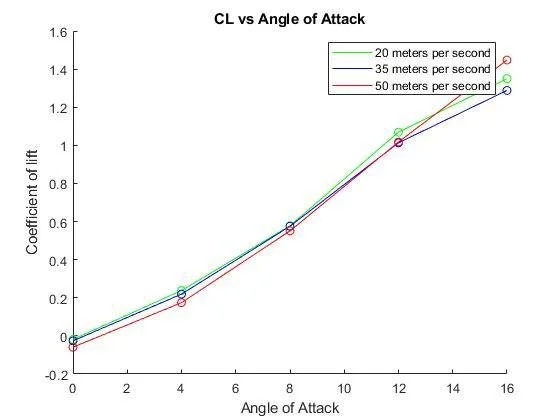
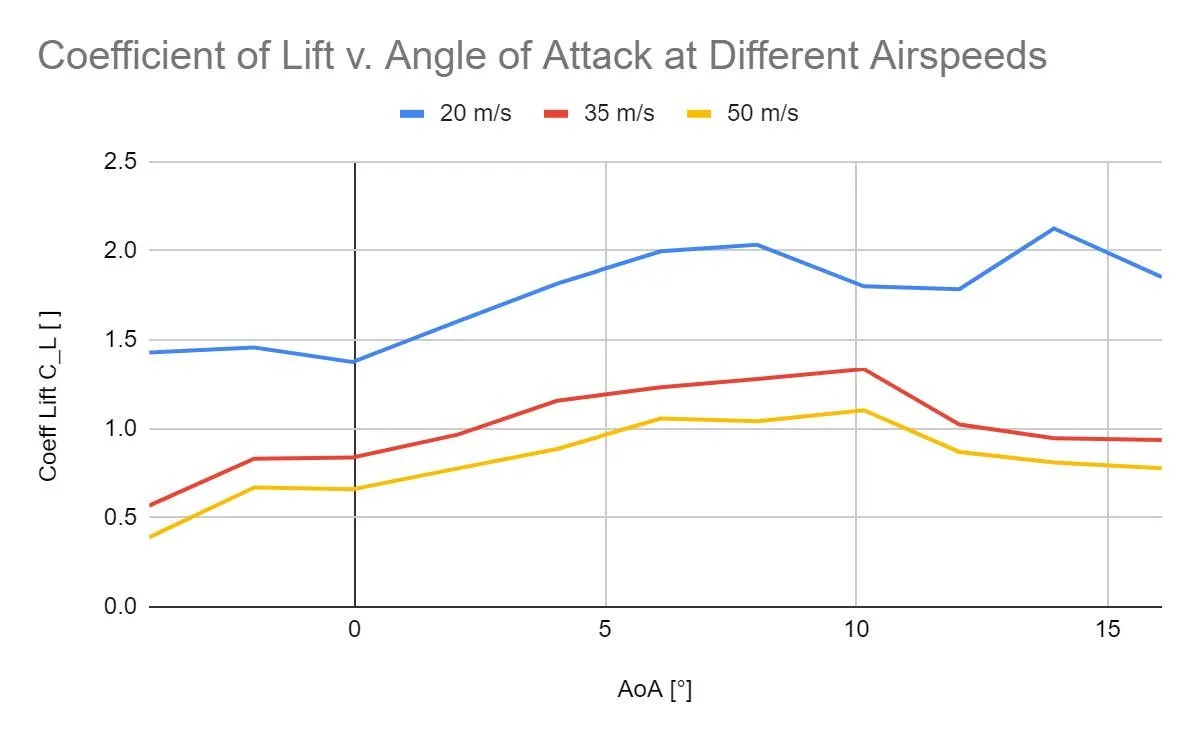
Coefficient of lift on the airfoil vs AoA at 20, 35, and 50 m/s
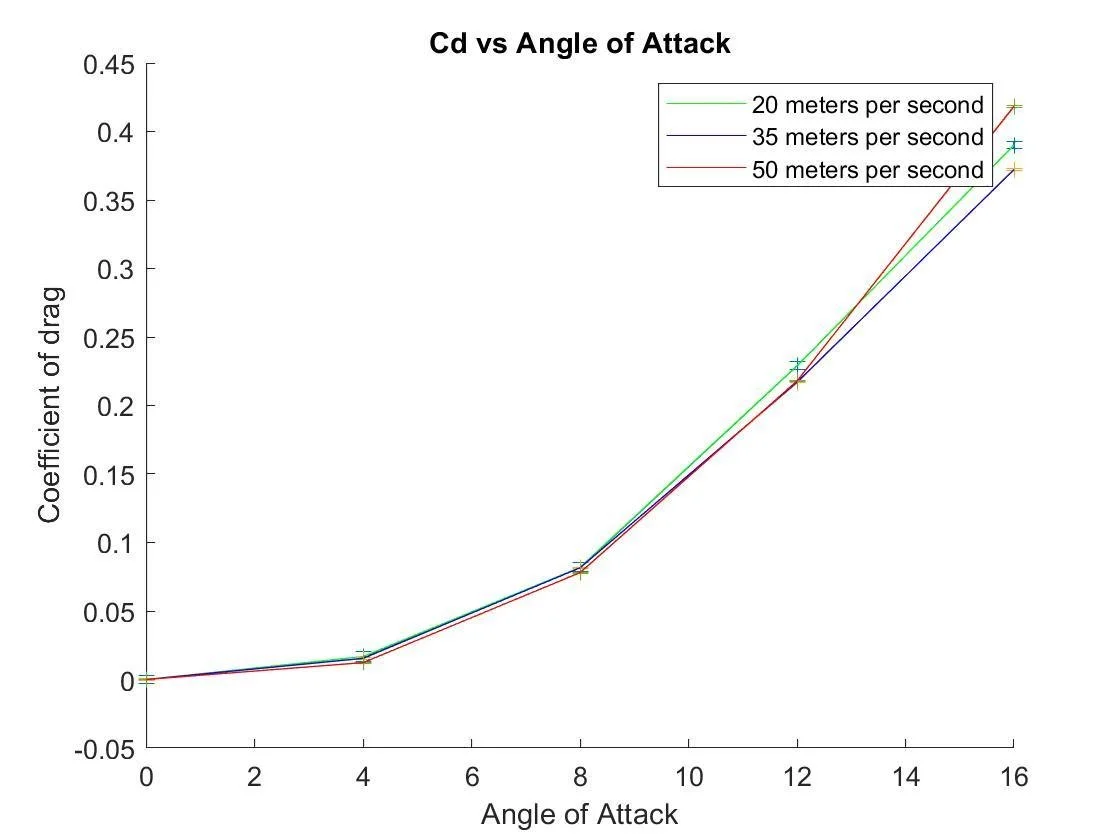
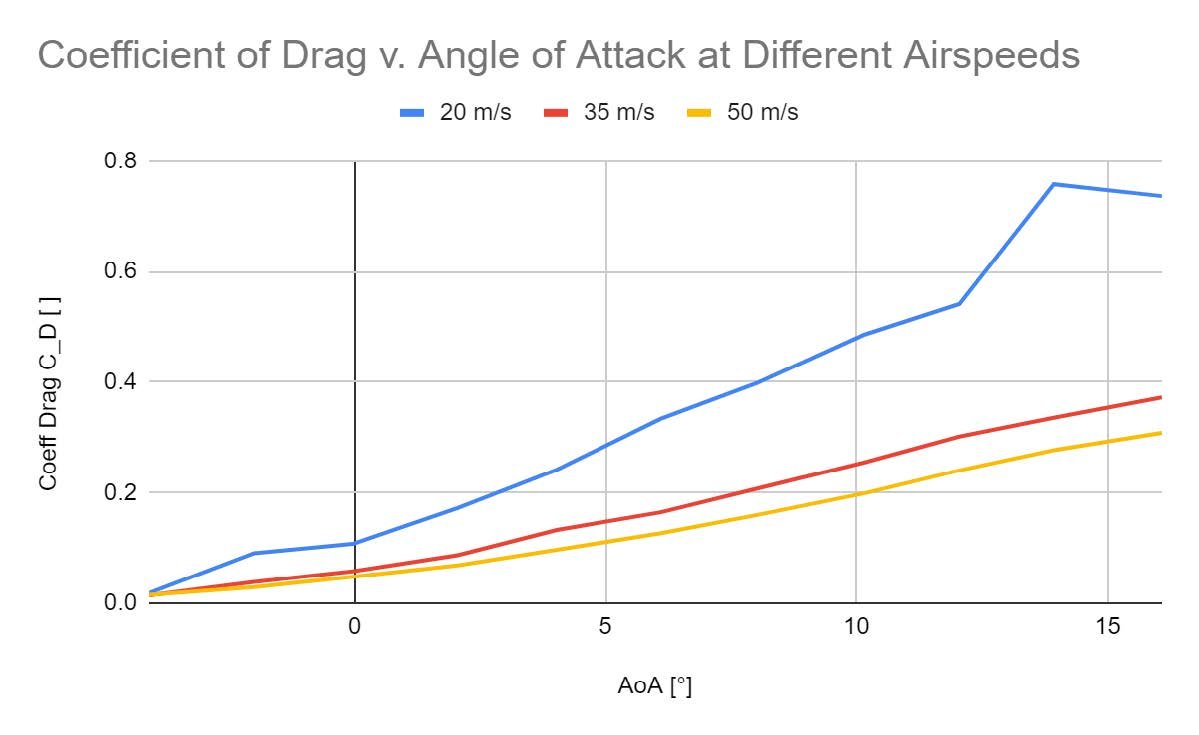
Coefficient of drag on the airfoil vs AoA at 20, 35, and 50 m/s
The coefficient of drag was measured using two different methods. The first method computes drag coefficient from the center of pressure data, which gave results that begin very close to zero and grew with an increasing rate as the angle of attack increased. The 3 speeds tested follow very similar trends, up until a 12° AoA.
Drag was also calculated from the moment deficit downstream using the rake array from the airfoil. This estimate gave a very different result for air speeds of 20 and 35 m/s, but a similar shape at 50 m/s.
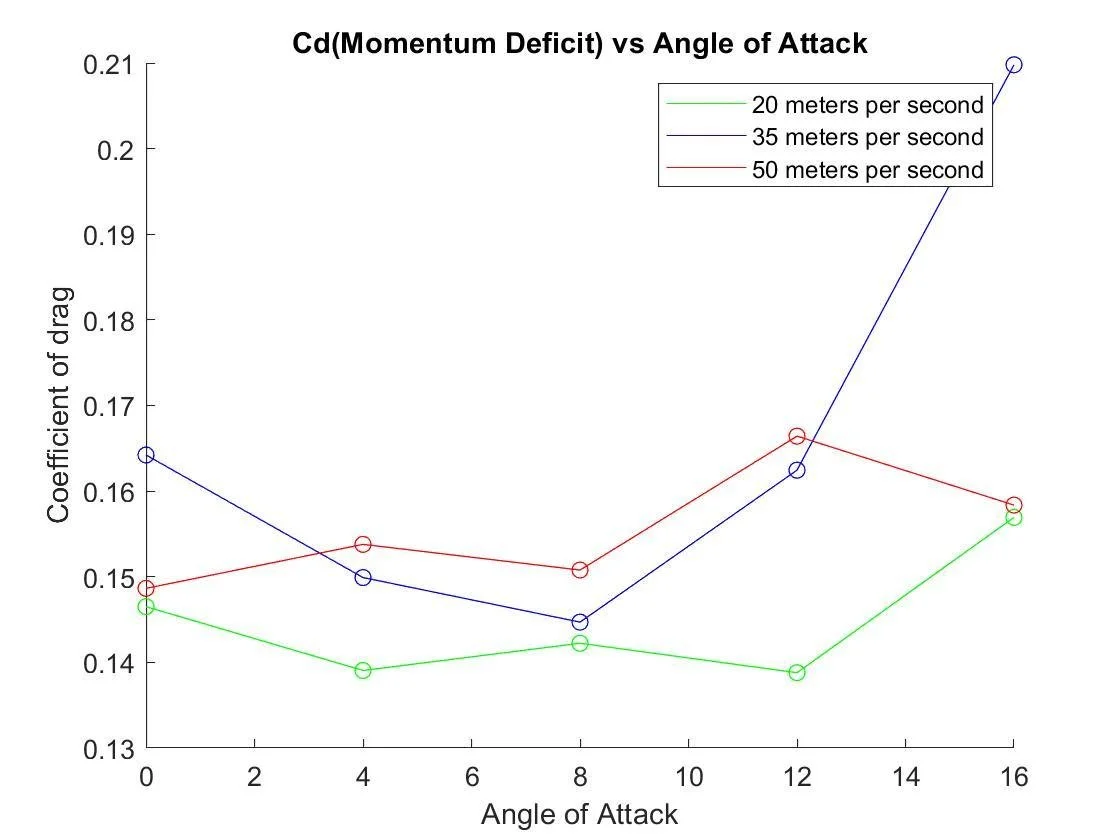
Coefficient of drag on the airfoil calculated from the moment deficit vs AoA at 20, 35, and 50 m/s
The wake distribution plots dynamic pressure downstream from the airfoil along a y-axis. They show where the airspeed was slowed by potential wake. Similar trends can be observed for the same AoA under varying airflow speeds.
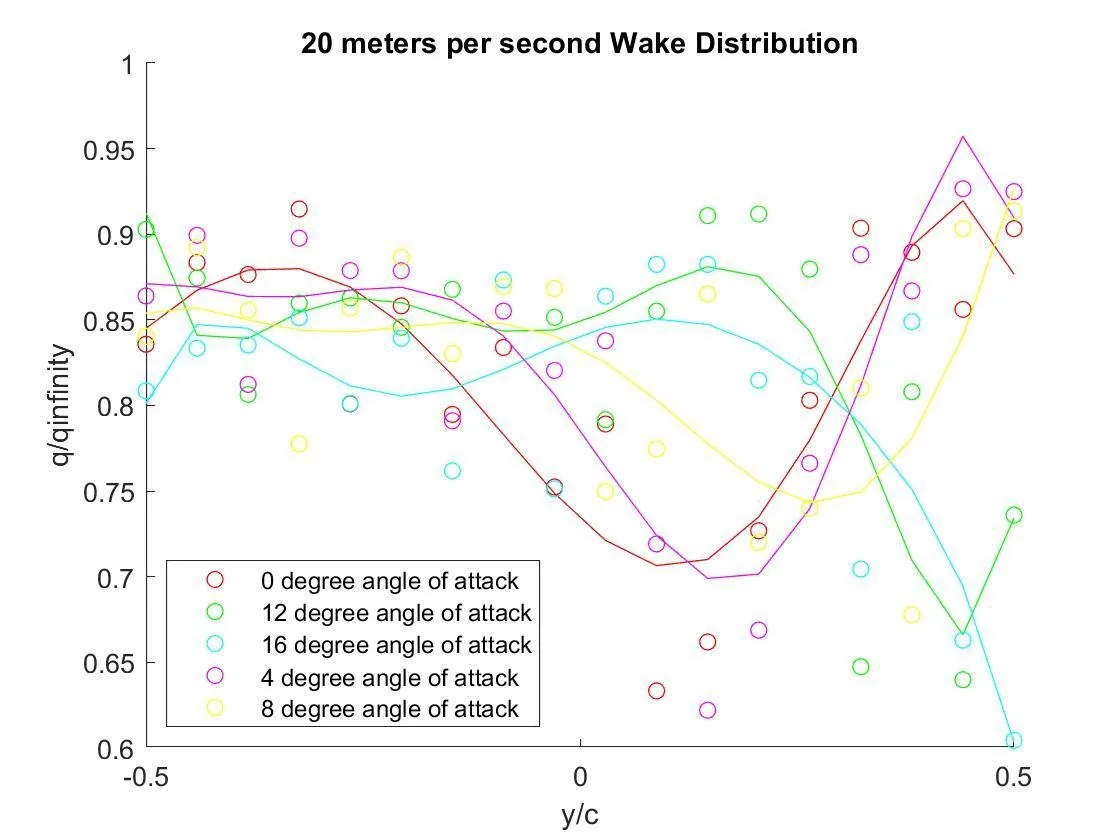
Normalized wake distribution downstream from the airfoil at 20 m/s
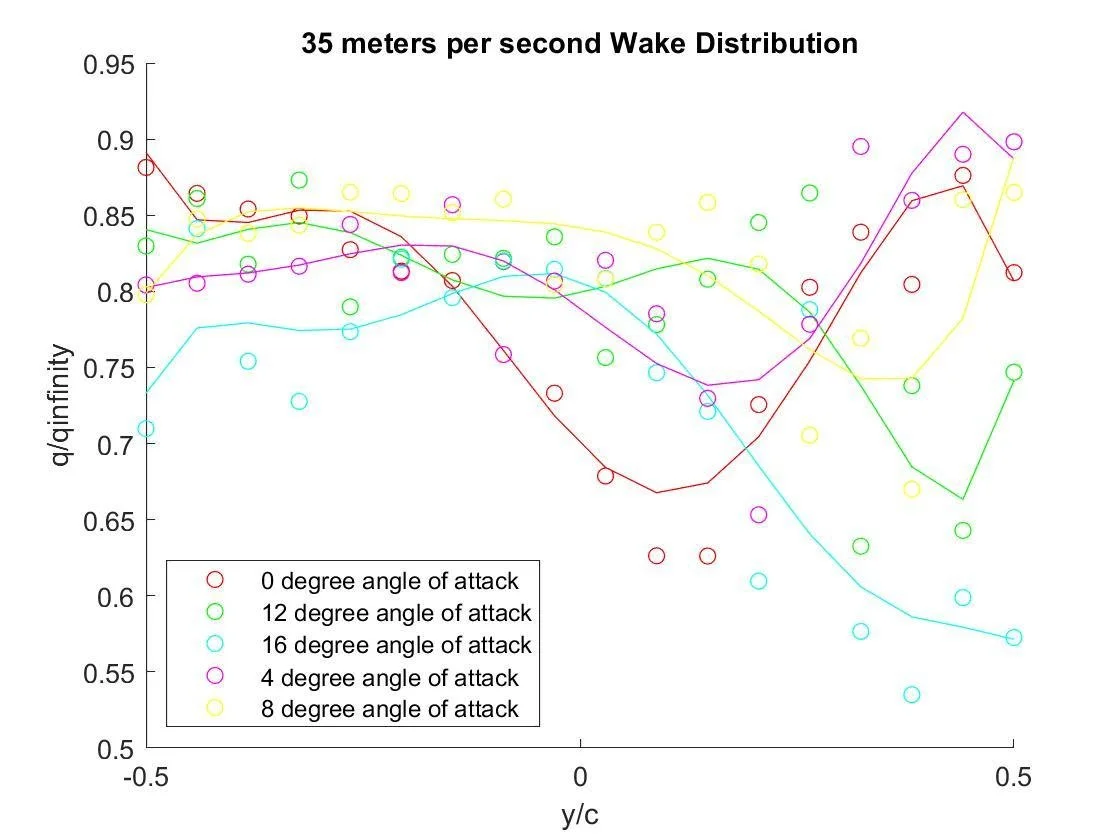
Normalized wake distribution downstream from the airfoil at 35 m/s
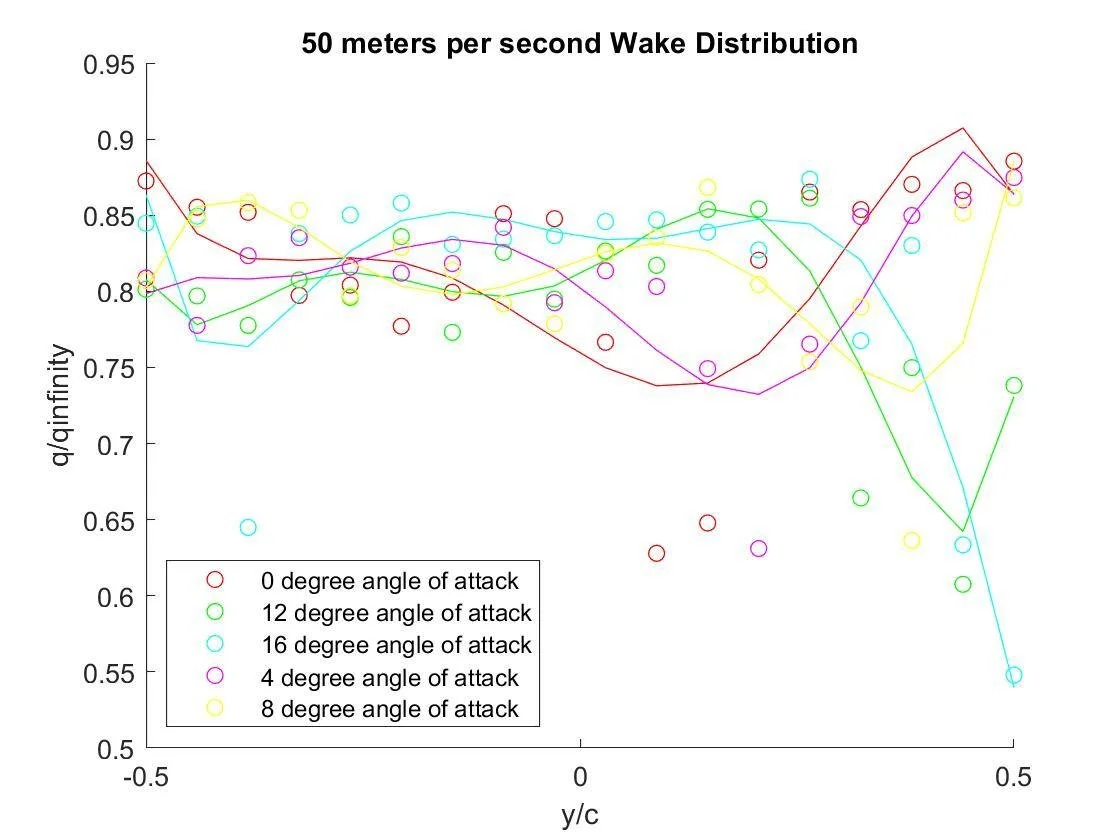
Normalized wake distribution downstream from the airfoil at 50 m/s
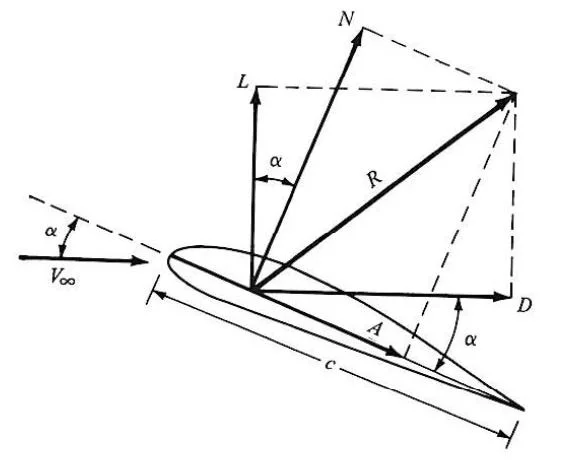
Free Body Diagram of Airfoil
Strain Gauge Sting Balance
From the Strain Gage Balance system the coefficients of lift and drag can also be found, with graphed values being averaged out over 1000 samples and standard deviations given by the program. As the airspeed experienced by the airfoil increases, there is a decrease in values for drag and lift coefficients.
The results show a significant decrease in the coefficient of lift and drag after 10 indicating that the critical angle of this airfoil to be 10° with stall to occur at 14°. The data also showed that the stall angle slightly decreased as the airflow increased, which indicates that the expected behavior is that the stall angle will get smaller as the airflow increases.
From the center of pressure data, the calculated coefficient of lift values continuously increased while data from the Strain Gage indicated a drop at 10°. The significant drop in the Cp value observed at 10° AoA, is consistent with the lift coefficient values found in the Strain Gage data and reinforces the stall angle of this airfoil is 10°.